Wednesday, April 15, 2009

The ABC's of 802.11

Props to this Xirrus blog for this great chart.

An overview on standards under the IEEE 802.11 (Wi-Fi) umbrella (as of Mar 09)

#Excerpted from http://www.ieee802.org/11/QuickGuide_IEEE_802_WG_and_Activities.htm)

Standard

Description

IEEE 802.11

The WLAN standard was original 1 Mbps and 2 Mbps, 2.4 GHz RF and infrared [IR] standard (1997)

IEEE 802.11a

A PHY to operate in the newly allocated UNII band.

IEEE 802.11b

A higher rate PHY in the 2.4GHz band

IEEE 802.11c

Provide the required 802.11 specific information to the ISO/IEC 10038 (IEEE 802.1D) standard

IEEE 802.11d

The current 802.11 standard defines operation in only a few regulatory domains (countries). This supplement will add the requirements and definitions necessary to allow 802.11 WLAN equipment to operate in markets not served by the current standard

IEEE 802.11e

Enhance the current 802.11 MAC to expand support for LAN applications with Quality of Service requirements. Provide improvements in security, and in the capabilities and efficiency of the protocol.

IEEE 802.11F

Specify the necessary information that needs to be exchanged between Access Points to support the P802.11 DS functions.

IEEE 802.11g

Develop a new PHY extension to enhance the performance and the possible applications of the 802.11b compatible networks by increasing the data rate achievable by such devices.

IEEE 802.11h

Enhance the current 802.11 MAC and 802.11a PHY with network management and control extensions for spectrum and transmit power management in 5GHz license exempt bands, enabling regulatory acceptance of 802.11 5GHz products. Provide improvements in channel energy measurement and reporting, channel coverage in many regulatory domains, and provide Dynamic Channel Selection and Transmit Power Control mechanisms

IEEE 802.11i

Enhance the current 802.11 MAC to provide improvements in security

IEEE 802.11j

Obtain Japanese regulatory approval by enhancing the current 802.11 MAC and 802.11a PHY to additionally operate in newly available Japanese 4.9 GHz and 5 GHz bands

IEEE 802.11k

The original standard has a basic set of radio resource measurements for internal use only. These measurements and others are required to provide services; such as roaming, coexistence, and others; to external entities. It is necessary to provide these measurements and other information in order to manage these services from an external source.

IEEE 802.11l

Not to be used by the IEEE 802.11 Working Group for inclusion into the published standard

IEEE 802.11m

Maintenance of technical and editorial corrections to the 802.11-2007 Wireless LAN Medium Access Control (MAC) and Physical Layer (PHY) specifications standard.

IEEE 802.11n

Improve the 802.11 wireless local area network (LAN) user experience by providing significantly higher throughput for current applications and to enable new applications and market segments.

IEEE 802.11o

Not to be used by the IEEE 802.11 Working Group for inclusion into the published standard

IEEE 802.11p

Amend the existing IEEE 802.11 standard to make it suitable for interoperable communications to and between vehicles.

IEEE 802.11q

Not to be used by the IEEE 802.11 Working Group for inclusion into the published standard

IEEE 802.11r

Improve BSS transitions within 802.11 ESS’s and to support real time constraints imposed by applications such as Voice over Internet Protocol (VoIP).

IEEE 802.11s

Provide a protocol for auto-configuring paths between APs over self-configuring multi-hop topologies in a WDS to support both broadcast/multicast and unicast traffic in an ESS Mesh using the four-address frame format or an extension.

IEEE 802.11T

Enable testing, comparison, and deployment planning of 802.11 WLAN devices based on a common and accepted set of performance metrics, measurement methodologies and test conditions.

IEEE 802.11u

Amendments to the IEEE 802.11 PHY/MAC layers which enable InterWorking with other networks. This includes both enhanced protocol exchanges across the air interface and provision of primitives to support required interactions with higher layers for InterWorking.

IEEE 802.11v

Amendments to the IEEE 802.11 PHY/MAC layers that enables management of attached stations in a centralized or in a distributed fashion (e.g. monitoring, configuring, and updating) through a layer 2 mechanism. While the 802.11k Task Group is defining messages to retrieve information from the station, the ability to configure the station is not in its scope. The proposed Task Group will also create an Access Port Management Information Base (AP MIB).

IEEE 802.11w

Improve the security of some or all IEEE 802.11 management frames by defining enhancements such as data integrity, data origin authenticity, replay protection and data confidentiality.

IEEE 802.11x

Not to be used by the IEEE 802.11 Working Group for inclusion into the published standard

IEEE 802.11y

Standardized the mechanisms required to allow shared 802.11 operation with other users in the 3650-3700 MHz band in the USA. Likely required mechanisms include: Specification of new regulatory classes (extending 802.11j), Sensing of other transmitters (extending 802.11a), Transmit Power Control (extending 802.11h) and Dynamic Frequency Selection (extending 802.11h).

IEEE 802.11z

Defines a new DLS mechanism which: a) Does not require access point upgrades (i.e. supports DLS operation with the non-DLS capable access points), b) Which supports power save mode (when associated with either DLS or non-DLS capable access points), and c) Continues to allow operation of DLS in the presence of existing DLS capable access points

IEEE 802.11aa

Specifies a standard for robust audio video stream transport over 802.11 for consumer/enterprise applications.

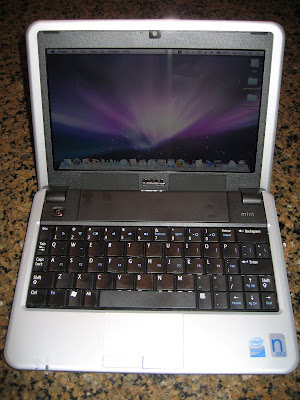
Hackintosh - Dell Mini 9

As a little 'project' - I ordered a little Dell Mini 9 - Netbook computer. Then proceeded to load a purchased licensed copy of Apple Macintosh OSX 10.5.6 on the little guy!The Dell Mini is a cute little netbook with the following specs. I ordered a copy with

  • 2GB RAM
  • Intel Atom 1.6GHz CPU
  • 64GB SSD (Solid State Drive)
  • Glossy 8.9 inch LED display (1024 pixels x 600 pixels)
  • 802.11g WiFi Card
  • 10/100 Ethernet
  • Bluetooth
  • 3 - USB 2.0 Ports
  • Built-in Webcam
  • Ubuntu 8.04 OS
  • Only 2.3 lbs
I got the extra RAM and big SSD drive so this would be fast enough and have enough HD space to be useful as a 'DVD Player' as well as do most of the things I do with my larger Macbook 13".

Following the directions and processes from this web site - I was able to use a couple of USB drives to copy, install, and then configure this to work just like my Macbook.
After loading the applications, I setup the Sync to my Mobile Me account, and thus the little guy is now working just like my main machine. A nice 'spare' Macintosh. Running Mail, Firefox, MS Office, iTunes, iPhoto, Things, Tweetdeck, and the AT&T 3G connection as well.
It's about 1/2 the size of my Macbook 13" Unibody laptop

I'm pretty proud of myself in getting a totally different OS loaded on this Dell. It works great!

OK - now for the things that I miss.
  1. the keyboard is a bit cramped and the ' key is in a weird place.
  2. two finger right click - doesn't work, so I have to go back to the right clicker, or use the CTRL Click
  3. two finger scrolling - not available (bummer)
  4. Screen is only 1024 x 600...
Sometimes when screens need more vertical screen-space, I use a program called 'Scale Resolution' to go to a 80% view, but that is very seldom. Additionally I use a Bluetooth mouse and all's good.

I highly recommend this - go get one!

How to 'Cheat' on a Survey - Don't Be A Victim!

Because of the flexibility and reporting capabilities built into most site survey applications, individuals can either knowingly, or accidentally, use these features to ‘Cheat’ and make survey data look different than it really is.

OK, I understand the word ‘Cheat’ is a pejorative, and connotes some sort of blatant attempt to break some rules or misrepresent. Many individuals just didn’t know any better when they applied these methods in their survey reporting. I’m not implying that these techniques suggest any malfeasance, only ignorance.

As a customer, the best protection against this type of deception is to request not only the paper or PDF report, but the actual data files so you can review and analyze the data directly yourself.

Below are some of the techniques that allow one to modify and present survey data to reflect whatever you might desire.

Be wary of using any of these techniques on your own analysis or in reviewing data presented by other third parties.

Method 1 – Incorrect Signal Propagation Value

One of the easiest ways to save money and time in the data-gathering phase of an RF site survey is to minimize the number of actual data points collected.

It is possible to use site survey software to interpolate a small number of data points and produce a complete ‘Heat Map’ of an entire building. The software and algorithms will usually allow for this. Just because the software can try and compensate for a poorly conducted survey doesn’t mean you should accept it.

A telltale sign this is being done is to look at the outside ‘arc’ of coverage. A tight Signal Propagation Assessment (SPA) value will have a tight arc, a large SPA or ‘guess range’ will have a very wide, almost flat, arc. Of course, if you have the actual survey data, you can see what the Signal Propagation Assessment value is set to.

This technique is used to ‘mask’ a survey with not enough data points and/or a survey that is showing ‘white’ areas on the floor plan. White does not mean there isn’t RF coverage; it just means there isn’t any data to support the heat map ‘painter’ to color that area.

I suggest you always go with an SPA no larger than that suggested by the survey application’s default values for the type of building you are surveying.

Method 2 – Using ‘Auto Contrast’

When configuring AirMagnet Survey, as an example of a site survey application, you can set the color adjustment to a variety of color palettes. Some of these are easier to see than others.

Note: Some persons with color-blindness have a hard time with the ‘smooth’ color gradients. There is one specific color option that is easier for them to see. But I find this very difficult for me to interpret because of the high-contrast changes.

One of the options in the Color Configuration is to set the ‘Auto Contrast Adjustment’ checkbox. Normally, the top of the color bar is always the same color, and the bottom is always its same color. Thus the middle is also always the same color. Thus a -65dBm is always represented by the same color on screen and in reports.

If you turn on ‘Auto Contrast Adjustment’ the top and bottom colors ‘move’ as you raise or lower the limits. Thus you can make -65dBm appear as any color you’d like.

This is a nice ‘feature’ is you already have a color palette and expectation; you can make AirMagnet Survey match to your expectations. But, in the wrong hands this one tool allows one to make any survey look good or bad. Any color can mean any dB!

The telltale sign this is being used is when the bottom of the color palette, like red for example is NOT showing for -100dB, something higher on the scale.


I have seen some companies actually use this technique to ‘standardize’ their reports so the same colors always mean the same dBm. Unless you are closely attuned to their legend, you’ll be misled on the signal strengths.

I recommend locking on a single color palette, turning off Auto Contrast Adjustment and having consistent universal colors on all your surveys. Green will always mean the same thing; Blue always the same, etc.

Method 3 – Use of ‘Banded’ Color Schemes

Another one of the many Color options typically available is ‘banded colors’. The use of this color option is sometimes applied to show what is ‘acceptable’ or not. Above a certain color band is approved, and below is unacceptable.

The problem with this technique is that there is often only a single dB difference between the color bands. So the strong, high-contrast line between acceptable and unacceptable is only 1 dB… This mis-represents the actual data and how close the subtle changes in RF are.

Smooth color palettes represent these slight changes in RF in a more representative fashion.

Method 4 – Access Points Where No Data Exists

Site survey software and algorithms often compensate for a poorly collected survey by generating ‘phantom’ data based on where an end-user ‘places’ and access point on the survey screen.

It is easy and possible for accidents to take place and an access point is placed not where it is in real life, but where you’d like it to be. Or the opposite, one can place an access point where it is in the real world, but not have any data collection points near that location.

In either case, the calculated and interpolated data is manipulated by the site survey software to generate RF data to support in placement location and power setting of the Access Point in question.

If your data collection is accurate and has followed all of the survey rules, there should be no need to process the data with this access point placement. If you do need the graphic of the access point on the screen, just place it without processing the data. (Display Only) When used incorrectly, the results show much stronger signals around the access point than were actually collected during the survey.

Note: If you show the resulting screen with placed-and-processed access points using the 3D display option you’ll easily see these ‘phantom’ results. I call it the ‘Circus Tent Syndrome’ – each access point has a little volcano looking mountain directly around its center point.

If there are no data capture points (red dots or blue dots) near an access point, but it shows very strong signal, then someone has mis-used this feature.

Method 5 – One-Sided Guesses

No ‘One Way Guesses’. This happens when you don’t capture on both sides of what you care about. If you take one data capture point on the inside perimeter of your building, and don’t also take one on the outside, then the site survey application doesn’t know anything about the ‘thickness’ (in RF Attenuation) of the exterior wall. It ‘learns’ this by having data captures on both sides of the wall.

If your survey was more ‘inside out’ the data processing algorithms must assume there is no walls, and uses a free-space-loss calculation. In the absence of better data (both sides of what you care about) – free-space-loss is all the software has to go on.

If you look at your survey results and there is heat map information, but you can see a wall between where the data point was collected, and a location where you ‘care’ – the resulting heat map will be incorrect.

Method 6 – Not Enough Data Points

This is usually the sign of a ‘lazy’ survey. Not only does the fact there is not enough data points lower the accuracy of the survey, more importantly it usually also comes with an increase in the Signal Propagation Assessment value to offset the lack of data to start with.

If the SPA is set to 5m, then there needs to be a red dot or a blue dot every 5m. Simple. More dots is fine, but fewer dots than your SPA will result in white spaces showing up on the floor plan. Then you might be tempted to increase the SPA in order to ‘hide’ these white spots.

Method 7 – Un-calibrated Survey

When you start a new site survey project, you are given the option to enter the drawing’s dimensions (not the building’s dimensions, but the drawing’s dimensions). If you leave it blank, (normal) some survey applications, such as AirMagnet Survey, will calibrate your drawing to a square 120’ x 120’. This will be your telltale sign you have NOT calibrated yet.

Calibration should be the first thing you do after starting a new project. If you forget, and go about your survey collecting data – it is very difficult, if not impossible to accurately adjust all the data to the new calibration after the fact. So, if you see a 120’ x 120’ in the site dimensions you have a survey that is un-calibrated!

In AirMagnet Survey in particular, above the upper right corner of your drawing there is a little dimension line. This is NOT the dimension line of your building, but what AirMagnet is using. Just because you have one there does not mean your drawing is calibrated.

Also, if you ever see a floor plan that looks a bit ‘off’ – like the X or Y axis is skewed – this is also a telltale sign you have an un-calibrated drawing.

Method 8 – PDF or JPEG Only

As a customer, you should request the PDF report, possibly the survey graphics in JPG format, but most importantly are the actual survey files. This way you can do your own analysis.

Another means of mis-representation is to not include the walking paths and data collection points. This, coupled with a high SPA (Guess Range), can be a sign the presented survey data is far too optimistic.

To properly analyze the survey data, you need to know where the data was collected and what data has been interpolated.

Don’t settle for just a report; require the data files along with the reports.

Method 9 – Showing Only the Results for a Single SSID

When analyzing survey data, it is very sometimes appropriate to include ONLY a specific SSID in the data set. In fact, this is the preferred method when analyzing for a (STA’s) device’s specific design requirements.

But, when doing analysis on interference (collision domains), ALL RF signals and access points should be included. These ‘other’ devices still have an effect on the collision domains of ‘your’ access points and clients (STAs).

The subset of collected data you are analyzing is important. Sometimes you need to look at ALL the data, and other times just the SSIDs you care about.

Conclusions

Whether it’s on purpose, or merely an oversight, the use of any of these aforementioned methods may present site survey data in an inaccurate light.

Be forewarned and prepared to make an accurate evaluation of the survey data presented to you.

If you are the one presenting Survey Data... be sure to take an accurate survey (following all seven rules) and don't use any of the above techniques. You don't want to be a 'cheater' do you?

Again another adage; Just because the software allows you to manipulate the presentation of the data doesn’t mean you should!

Keith Parsons, CWNE #3
The WLAN Iconoclast
Keith at inpnet.org
April 4th, 2009
Orem, UT, USA


Additional Articles for Supporting WLAN Site Surveys
- 7 Rules for Accurate Site Surveys
- How to 'Cheat' On A Survey - Don't be a Victim
- How to Properly Analyze Survey Data
- The Fallacy of Channel Overlap
- Predictive Survey vs Onsite Survey - What's the Big Deal?
- How to 'Spec' your Network's Physical Layer
- Want, Don't Want, Don't Care - Meeting Design Specs
- The Truth about SNR - Where Did that 'N' Come From Anyway?
- What is an Access Point Anyway - Hub, Bridge, Switch or Router?
- Passive vs Active - What's All the Fuss About
- The False God of dB
- Meeting All Device Design Parameters

The Fallacy of Channel Overlap

We’ve all seen the design specs calling for Access Point overlap of some 15% to 30% depending on who’s talking. I think this is just pure *&^#@...

If you can not measure it… then don’t use it in your design spec!

Someone telling you, “I’ll know it when I see it” just isn’t good enough. We need to be able to PROVE or VERIFY that our wireless networks meet a design specification.

Calculating Overlap

Might I suggest that no one has calculated this ‘overlap’ properly? I, for one, don’t have the math skills necessary to do it properly.

Here’s an example (we’ll start out with an easy one)


This picture is obviously represents 0% overlap or no overlap at all.


Ok, now for a bit harder…


What is the overlap here?

Don’t jump right to your foregone conclusion… Let’s think about it first…

This is:

50% overlap of Diameter

100% overlap of Radius

29% overlap of Circumference

23% overlap of Area


The calculation to get the Diameter and Radius were pretty much brain-dead easy… but the other two, not so much…

Here’s just the example for the calculation of area when two circles intersect.


With the following associated formula:


Getting to Reality

Are telling me you do this calculation for each and every access point where it intersects with another one of your access points in your WLAN designs? I think not.

Not to mention, access points radiation patterns are never ‘really’ circles but normally look more like amoebas or starburst type patterns… do you even know how to start calculating those areas’ overlap?

So again, If you can’t measure it, then don’t include it in your design specs!

What you CAN calculate, and SHOULD be using, is the effect of overlap on individual clients. You can use this calculation to ‘prove’ or ‘verify’ that your WLAN design is meeting the actual design spec of your specific STA (device).

In AirMagnet Survey, this is found in AirWise and set the requirement for 2 access points at say -67dBm.

It’s pretty easy really. The reason we have this ‘overlap’ thing is to make sure the STA’s have adequate duplicate coverage. In other words, each STA needs to see at least one access point at a specific RSSI, and a ‘backup’ or secondary access point at a different RSSI.

Some vendors spec the same for both the primary and secondary – like some VoIP phones want to see a primary at -67dBm and a secondary also at -67dBm – or in other words – two at -67dBm.

Now this we can easily measure!

Just complete a passive survey with your favorite tool of choice and ask the system to show where in your network coverage areas you see TWO access points with a signal greater than -67dBm.


No more trying to guess on percent overlaps, no more making up some ‘eyeball’ answer. Just a plain and simple answer to the question –

Do I have adequate coverage to meet the design specifications of my client (STA) devices?


By the way – you’ll need to do a survey following all the rules of proper surveying. Of course, you always follow the rules, right?

Conclusions

Don’t pretend to be able to calculate access point coverage overlaps using a graphic based on area. Look at this from the client’s point of view, and make sure you have the correct RF everywhere to meet the ‘backup’ needs of the clients.

Keith Parsons, CWNE #3
The WLAN Iconoclast
Keith at inpnet.org
March 28th, 2009
Orem, UT, USA


Additional Articles for Supporting WLAN Site Surveys

- 7 Rules for Accurate Site Surveys
- How to 'Cheat' On A Survey - Don't be a Victim
- How to Properly Analyze Survey Data
- The Fallacy of Channel Overlap
- Predictive Survey vs Onsite Survey - What's the Big Deal?
- How to 'Spec' your Network's Physical Layer
- Want, Don't Want, Don't Care - Meeting Design Specs
- The Truth about SNR - Where Did that 'N' Come From Anyway?
- What is an Access Point Anyway - Hub, Bridge, Switch or Router?
- Passive vs Active - What's All the Fuss About?
- The False God of dB
- Meeting All Device Design Parameters

iPhone Apps for Wireless LAN Professionals

Below is a list of the Apps I use on my iPhone to help me work on Wireless LANs.

WiFiFoFum
a quick easy way to see the local WLANs with channel, signal strength and security. It also has one of those 'weird' radar views - totally useless, it has no actual info on direction, only simple RSSI.
WiFiTrack
Lists local WLANs by Open vs Locked. Includes Signal, Channel, and type of encryption, ie. WPA2/Radius... Clicking on an AP will also give you the MAC address and if the AP is broadcasting SSID. This one also allows you to connect to a new AP directly from the App.
Network Utility
This is not a WiFi specific tool, but it does allow you to Ping, Scan IP Ports, GeoIP Lookup, Whois Query. In addition, you can use it to find your Internal and External IP Addresses.
iNetInfo
A quick way to see your IP Address, Hostname, MAC, Default Gateway, DNS.
Snap
This one will scan your local subnet and report on all the devices it can 'see'. Not just the APs, but all the clients on your subnet. Clicking on a seen device give you it's IP, MAC, OUI and if it answers a PING. You can then do a scan for supported services on that specific device. Kind of fun to use to see what is OPEN around you.
Bytes A binary calculator with a great set of tools for doing a variety of binary and bit-level manipulation on top of Unit conversion and a quick reference for 2 to the x power results.
GPS Utility
I use this tool to convert Lat/Long specs from Minutes/Seconds to decimal. (AirMagnet Survey using an outdoor GPS survey needs decimal, and most mapping software uses minutes/seconds)
I really wish someone would combine all of these Apps into a single program that does everything.


Anyone else find some other useful App to add to my iPhone?

What's Your Favorite App?

Sunday, March 22, 2009

Seven Rules for Accurate Site Surveys

Seven Rules for Accurate Site Surveys

The process of gathering appropriate and accurate data during a Site Survey is as simple as following a few easy rules.

Break the rules, however, and you could end up with totally useless – but colorful – Heat Maps that have no value to your organization.

These rules have been gleaned through hundreds of site surveys and through teaching over hundreds networking professionals how to use Site Survey products.

Rule 1 – Calibrate Your Drawing Properly

Setting the underlying ‘grid’ is critical. If you don’t accurately calibrate the drawing to reflect the reality of the actual building, with the drawing on your screen – all your data will be virtually worthless. This is #1 in the list because it is the most important step, and you should always do it correctly as soon as you open a new project.

Do not use a doorway as your ‘baseline’ to calibrate from. Use a longer dimension, as long as you can measure. I use a Laser measuring device that works out to 50m or so. Measuring wheels, long tape measures, laser, or sonar all work; just try to find the longest edge. You only need to have one dimension to accurately calibrate a drawing that comes to you with the correct aspect ratio.


Better yet, have the CAD folks drop a Dimension Line underneath the actual building on the drawing to give you an even more accurate line to calibrate against.

Note: While we’re on the subject of the drawing, simplify your drawings as much as possible, using only black and white. ‘Flatten’ the drawing down to just the simple floor plan, no need for furniture, plants, where the jacks are located. Just simple black on white walls in your drawing is best

Rule 2 – Set the Channel Scan to the Correct Frequencies

Scan ONLY the channels you want, and don’t scan the channels you don’t want. This sounds simple… but making a mistake here can cost you greatly in the accuracy of the post survey data. If you ‘accidentally’ set it to scan ALL channels (over 200 are available to scan) – even at only 250 ms each (1/4 second) the system will nearly a minute of time to return back to the starting channel. (and you can walk quite a long way in a minute!)


I recommend setting the scan channels to the 11 (or 13) base 2.4 GHz channels and the 5 GHz channels for your regulatory domain (in the US this can be the 4 Indoor Only, plus the 4 Indoor or outdoor channels) and do a passive survey of the outside perimeter of your building first.

This will give you a nice capture of your neighbors, as well as your ‘leaking’ RF. But better yet – it will give you a nice set of channels to concentrate on when moving indoors to do the real Site Surveys.

Perhaps even do two survey walks, one for 2.4 GHz and one for 5 GHz channels. That, or watch the bottom left corner of your survey screen and don’t move to the next data capture point until the channel scan marker returns back to ‘1’.

Scan what you want, and don’t scan what you don’t want!

Rule 3 – Set Your Guess Range Properly

This goes by the more professional term ‘Signal Propagation Assessment’ – but it basically means how far do you want your Site Survey application to ‘guess’ (Interpolate) in between your captured data points.


A really accurate survey would set this down to one meter. But the problem there would be that you’d have to go and click on every single meter of space in your building. Accurate yes, but practical, no.

Or the opposite, go to the center of your building and take a single data snapshot… then set the Guess Range to 50 meters… This one is easy and quick, but not accurate at all.

Reality is somewhere in between. Most survey applications have a couple of pre-defined options for you. You do not have to use these pre-defined Signal Propagation Assessment (SPA) numbers. Use what you think appropriate for your site; the smaller the better. It will force you to take more data points and thus get more accuracy.


For most indoor buildings, I like about a 5m Signal Propagation Assessment value.


Rule 4 – Set Appropriate ‘Snap Rate’ For Your Situation

The automatic snap rate is based on a time. You set the number of seconds when your survey application will take an extra ‘snapshot’ of your RF information. Too fast and you’ll get ‘blue lines’ with too much information and slow down your processing. Too few and your snaps will be too spread out. (Think of Goldilocks… just right…)


If you are doing a Manual (red-dot-only) survey – be sure to take a snapshot no further than what your SPA is set to. So if you set your ‘Guess Range’ or SPA at 5m, you must take a snapshot (click) at least every 5m.

Rule 5 – Capture on Both Sides of What You Care About

No ‘One Way Guesses’. This happens when you don’t capture on both sides of what you care about. If you take one data capture point on the inside perimeter of your building, and don’t also take one on the outside, then your survey application won’t know anything about the ‘thickness’ (in RF Attenuation) of the exterior wall. It ‘learns’ this by having data captures on both sides of the wall.

If you don’t care about the RF leaking outside, then this is fine. But if you do care about some area, whether it is inside or outside, you must do data captures on both sides.

Thus another corollary to this rule – Capture Outside In, Not Inside Out. Capture on the perimeters of the rooms you want to prove coverage – not one single shot from the center of each room.

One additional part to this rule; If you have ‘special’ places you need to be real sure about – then take extra data captures at those locations, ie. CEO’s desk, Board Room, etc.

Rule 6 – Click Accurately

You don’t actually walk through walls, walk on water, or fly when you are doing a Site Survey – don’t have your data look like you did or your credibility will be shot.

Prepare your walking paths in advance. You might even put little numbers on your drawing before you import it with the locations where you want to click (capture data) – and then you’ll just have to play ‘connect the dots’ with your feet later during the survey.

The old adage, Fail to Plan means Plan to Fail… holds true in this respect. I’ve seen many people who get lost, or get stuck down the end of a hallway and don’t seem to know what to do with the Survey, or where to go next. Preparation is key on this point.

If you can’t easily find yourself on the floor plan – it is a skill that can be practiced you know – then work on it until you are comfortable moving around in three-dimensional space.

When you are doing an AirMagnet Survey ‘manual’ survey, with red dots only, the dots are connected with dashed lines. These dashed lines, without blue dots, can go through walls, walk on water, and fly… it’s the autosnap blue dots we worry about.

Note: Here’s a trick to use while doing a survey. While standing still at the end of one data capture point, place your mouse cursor at the next place you plan on stopping, then start walking. When you arrive at the designated point, you only need to ‘click’ and the data point is collected right under where the cursor was waiting.

Anytime you can see a specific marking on a blueprint or floor plan, add a click for accuracy. Of course, you could walk the entire hall and your survey application would place all the data points as soon as you finished the length of the hall. But accuracy improves as you have accurate intermediate click points.

If you don’t go to all the locations and click accurately, you’ll be tempted to increase your SPA to ‘fill in’ the missing data points. (no one likes to see white spots on their heat maps).

Rule 7 – Always, Always Do A Passive Survey

You might have a reason to also do an Active Survey, (see Passive vs. Active Surveys article) but you ALWAYS must do a Passive Survey on the entire building you care about. I’d also recommend doing a Passive Survey on the exterior of the building as well.

A Passive Survey can give you information on your neighbors, others, and all of your own devices.

This is especially important for determining RF interference. If you don’t have neighbor information in your Active Survey, you can easily miss the interference on specific frequencies. Additionally, this can show you where your ‘collision domains’ are.

In addition to these rules that pertain to Passive Surveys, Active Surveys have some rules of their own.


Additional Rules for Active Surveys

Capture Data from ALL Access Points
It is quite easy to do an active survey and only get data on a subset of your Access Points. You can merge this with a Passive Survey data set and end up with what looks like an accurate survey, but it is NOT. You need to have ALL Access Points included in your Active Survey for accurate representation of your RF WLAN environment.

Capture To The Edge
When capturing Active Survey data from an Access Point, it is easy to not go to the edge of the coverage area… it’s so far to walk – so we might stop as soon as we can see the coverage meets some design goal, like -65dBm. But this is where the failure lies. The easiest requirement to design for a WLAN is RF Coverage, but it is only the first of many requirements (see False God of dB article). The hard thing to deal with is the interference, and you’ll only learn about this if you capture data to the edge of each Access Point’s coverage area. (yes, I know this is hard and expensive to do!)

Do NOT Set Roaming To Be Too Aggressive
I understand you may have the great power to over-ride the WLAN NIC’s roaming decision process with your survey application’s roaming options feature. This makes surveying much faster and easier. Don’t succumb to the temptation! If you set the Roaming Option to only connect at 54, 48, and 36 data rates, then your data will only show 54, 48, and 36 data rates. Since you didn’t capture the other data rate information, your report won’t show it to you.

In reality, your client cards will roam according to their own algorithms and will downgrade to whatever data rates are supported in the Access Points.

And another adage that should always be remembered with respect to wireless LANs – just because you can, doesn’t mean that you should.

De-Skew Data In Sticky Situations
Sometimes when taking an Active Survey the data gets a bit ‘skewed’ in the direction of travel: away from the access points. If this is the case you’ll need to do two Active Surveys for each access point, one clock-wise and one counter-clockwise and then merge those together to ‘de-skew’ the stickiness.

Merge All Actives Before Merging With Passive
Just like it says.

If You Don’t Do Active Surveys Right – Don’t Do Active Surveys At All

If you do Active Surveys wrong, you’ll end up with a less-accurate and ‘worse’ data set than not doing any Actives at all.

Conclusions

Obey these rules or else… Or else the data you capture will be suspect at best, and totally useless at worst.

Also – don’t let your sub-contractors break the rules or ‘cheat’ on you either. Check out the How to 'Cheat' Using Survey - Don't be a Victim article.

Keith Parsons, CWNE #3
The WLAN Iconoclast
Keith at inpnet.org
March 21st, 2009
Orem, UT, USA

Additional Articles for Supporting WLAN Site Surveys

- 7 Rules for Accurate Site Surveys
- How to 'Cheat' On A Survey - Don't be a Victim
- How to Properly Analyze Survey Data
- The Fallacy of Channel Overlap
- Predictive Survey vs. Onsite Survey - What's the Big Deal?
- How to 'Spec' your Network's Physical Layer
- Want, Don't Want, Don't Care - Meeting Design Specs
- The Truth about SNR - Where Did that 'N' Come From Anyway?
- What is an Access Point Anyway - Hub, Bridge, Switch or Router?
- Passive vs. Active - What's All the Fuss About
- The False God of dB
- Meeting All Device Design Parameters

Monday, March 9, 2009

Why this blog

I've been traveling around the world consulting and teaching Wireless Networking for the past 7 years or so. In those travels I've met with, consulted, taught, and enjoyed my time with hundreds of folks involved in the Wireless LAN industry.

I've also learned many things about Wireless Networks... many of these are a bit 'contrarian' to the generally accepted views.


This blog is a 'home' for those views.


Keith Parsons
Managing Director

Institute for Network Professionals

HOT Labs